Traditional Finances
Traditional Finances Summary
Expenditures and Revenues used to calculate the per capita values were derived from all budgeted governmental funds of the County. The estimated population at the end of fiscal year 2025 was 975,191.
Property taxes totaled $501.8 million for fiscal year 2025 which makes up 64% of the County’s operating revenues. Sales taxes totaled $23,898,382 for fiscal year 2025 and are collected for the benefit of County Assistance Districts.

| Expenditures | |
|---|---|
|
Total Adopted Budget |
$731,632,966 |
|
Total Expenditures |
$779,005,300 |
|
Population |
975,191 |
|
Population Source |
United States Census Bureau Quick Facts, Population estimates, July 1, 2025 |
|
Total Expenditures per capita |
$799 |
|
Total Full-Time Positions |
3,576.80 |
| Revenues | |
|---|---|
|
Total Adopted Revenues |
$670,845,099 |
|
Total Property Tax Revenue |
$501,813,824 |
|
Total Revenues |
$783,965,082 |
|
Total Sales Taxes |
$23,898,382 |
|
Population |
975,191 |
|
Population Source |
United States Census Bureau Quick Facts, Population estimates, July 1, 2025 |
|
Property Tax Revenues per capita |
$515 |
|
Total Revenues per capita |
$804 |
|
Total Sales Taxes per capita |
$25 |
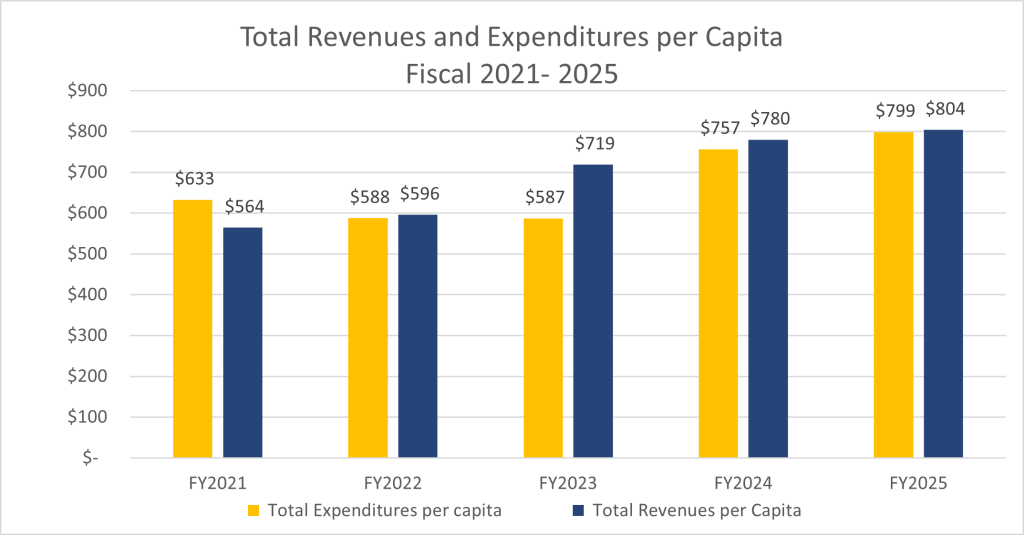
The graph below represents five years comparison of Revenues and Expenditures per Capita for all budgeted Governmental Funds for Fiscal Years 2021-2025.
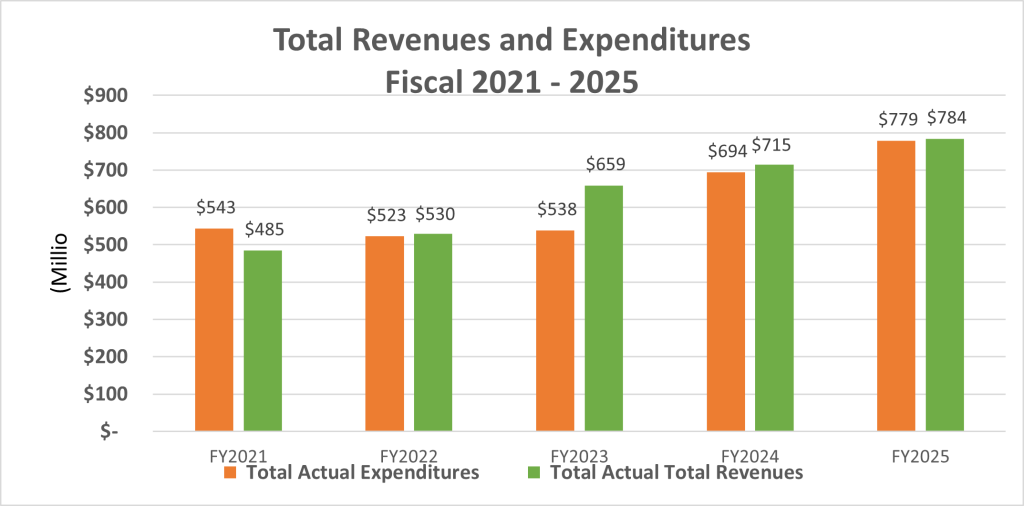
The graph below represents five years comparison of total Revenues and Expenditures for all budgeted Governmental Funds for Fiscal Years 2021-2025 in millions.
The graph below represents five years comparison of Property Tax Rates per $100 valuation for Tax Years 2020-2025.
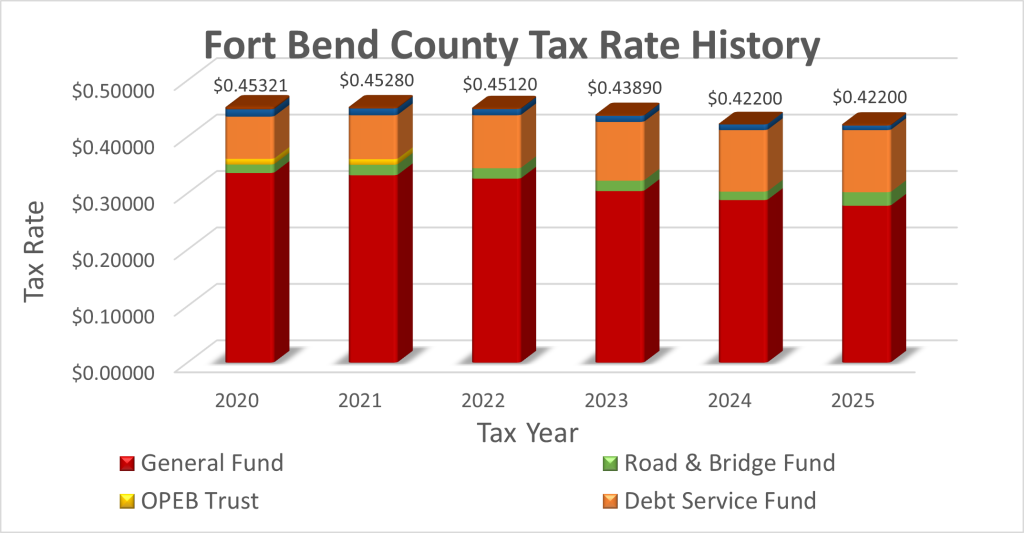
The table below is the tax rate detail represented in graph above.
| Revenues | General Fund | R&B Fund | OPEB Trust | Debt Service Fund | Drainage District M&O Fund | Drainage District Debt Service | Total County Rate | % Increase (Decrease) | $ Increase (Decrease) |
|---|---|---|---|---|---|---|---|---|---|
|
2020 |
$0.33600 |
$0.01500 |
$0.01000 |
$0.07488 |
$0.01300 |
$0.00433 |
$0.45321 |
-1.48% |
(0.00679) |
|
2021 |
$0.33200 |
$0.01850 |
$0.01000 |
$0.07780 |
$0.01200 |
$0.00250 |
$0.45280 |
-0.09% |
(0.00041) |
|
2022 |
$0.32600 |
$0.01850 |
$0.00000 |
$0.09380 |
$0.01090 |
$0.00200 |
$0.45120 |
-0.35% |
(0.00160) |
|
2023 |
$0.30400 |
$0.01850 |
$0.00000 |
$0.10400 |
$0.01080 |
$0.00160 |
$0.43890 |
-2.73% |
(0.01230) |
|
2024 |
$0.28800 |
$0.01500 |
$0.00000 |
$0.10900 |
$0.01000 |
$0.00000 |
$0.42200 |
-3.85% |
(0.01690) |
|
2025 |
$0.27800 |
$0.02400 |
$0.00000 |
$0.11000 |
$0.00800 |
$0.00200 |
$0.42200 |
– |
– |
Documents
Budget Policy
- FY2027 Budget Policy [PDF]
- FY2026 Budget Policy [PDF]
Budgets for current and previous fiscal years
FY2026
- Annual Operating Budget [PDF]
Annual Operating Budget [HTML]
FY2025
- Annual Operating Budget [HTML]
- Annual Operating Budget [PDF]
FY2024
- Annual Operating Budget [HTML]
- Annual Operating Budget [PDF]
- Annual Operating Budget [HTML]
- Annual Operating Budget [PDF]
- Annual Operating Budget [HTML]
- Annual Operating Budget [PDF]
Previous fiscal years
- Fort Bend County Annual Comprehensive Financial Report (ACFR)
- Fort Bend County Federal Single Audit Report (SEFA)
- Fort Bend County Juvenile Probation Annual Financial and Compliance Report
- Fort Bend Flood Control Water Supply Corporation Financial Report (FBFCWS)
- FY2015 FBFCWS
- FY2014 FBFCWS
- FY2013 FBFCWS (Final report in FY2015 due to dissolution)
- Fort Bend County Toll Road Authority Financial Report (FBCTRA)
- Fort Bend County Drainage District Financial Report
- Fort Bend County State Single Audit Report (SESA)
- Fort Bend County Community Supervision and Corrections Department Annual Financial and Compliance Report (CSCD)
- Fort Bend County Industrial Development Corporation Financial Report (FBIDC)
- FY2017 FBIDC
- FY2016 FBIDC
- FY2015 FBIDC
- FY2014 FBIDC (FY2014 first year of separate financial report)
- Fort Bend Grand Parkway Toll Road Authority Financial Report (FBGPTRA)
Investment Policy and Reports for the last five fiscal years
Investment Policy
FY2026 Investment Reports
FY2025 Investment Reports
FY2024 Investment Reports
FY2023 Investment Reports
FY2022 Investment Reports
FY2021 Investment Reports
FY2020 Investment Reports
Downloadable Data
Disbursements/Check Register in Excel Format
*Beginning in FY24, we have modified the layout of the Disbursement Report. All payments listed on the dated tabs will contain a complete listing of payments released by FBC. A new tab named “Pending Court Ratification” has been added and will include payments to be presented to Commissioner’s Court at their next meeting.
Other Information
Fort Bend County
Main Contact information
301 Jackson St, First Floor
Richmond, TX 77469
281-342-3411
www.fortbendcountytx.gov
Elected Officials Contact Information:
Application and instructions for Open Records Requests are available through our County Attorney:
Documents
- Budgets for the last five fiscal years through fiscal year 2019
- Fort Bend County Adopted Budgets
- Annual Financial Reports the last five fiscal years through fiscal year 2017
- Fort Bend County Annual Comprehensive Financial Report (ACFR)
- Fort Bend County Drainage District Financial Report
- Fort Bend County Federal Single Audit Report (SEFA)
- Fort Bend County State Single Audit Report (SESA)
- Fort Bend County Juvenile Probation Annual Financial and Compliance Report
- Fort Bend County Community Supervision and Corrections Department Annual Financial and Compliance Report (CSCD)
- Fort Bend Flood Control Water Supply Corporation Financial Report (FBFCWS)
- FY2015 FBFCWS
- FY2014 FBFCWS
- FY2013 FBFCWS
(Final report in FY2015 due to dissolution)
- Fort Bend Flood Control Water Supply Corporation Financial Report (FBFCWS)
- Fort Bend County Industrial Development Corporation Financial Report (FBIDC)
- FY2017 FBIDC
- FY2016 FBIDC
- FY2015 FBIDC
- FY2014 FBIDC
(FY2014 first year of separate financial report)
- Fort Bend County Industrial Development Corporation Financial Report (FBIDC)
- Fort Bend County Toll Road Authority Financial Report (FBCTRA)
- Fort Bend Grand Parkway Toll Road Authority Financial Report (FBGPTRA)
- Investment Reports for the last five fiscal years through fiscal year 2018
- FY2022 Investment Reports
- FY2021 Investment Reports
- FY2020 Investment Reports
- FY2019 Investment Reports
- FY2018 Investment Reports
- FY2017 Investment Reports
- FY2016 Investment Reports
Downloadable Data
- Adopted Budgets in Excel Format
- Disbursements/Check Register in Excel Format
Other Information
- Fort Bend County – Main Contact information
- 301 Jackson St, First Floor
Richmond, TX 77469
281-342-3411
www.fortbendcountytx.gov
- 301 Jackson St, First Floor
- Elected Officials and Department Head Contact Information: Contacts
- Application and instructions for Open Records Requests are available through our County Attorney: Public Information